

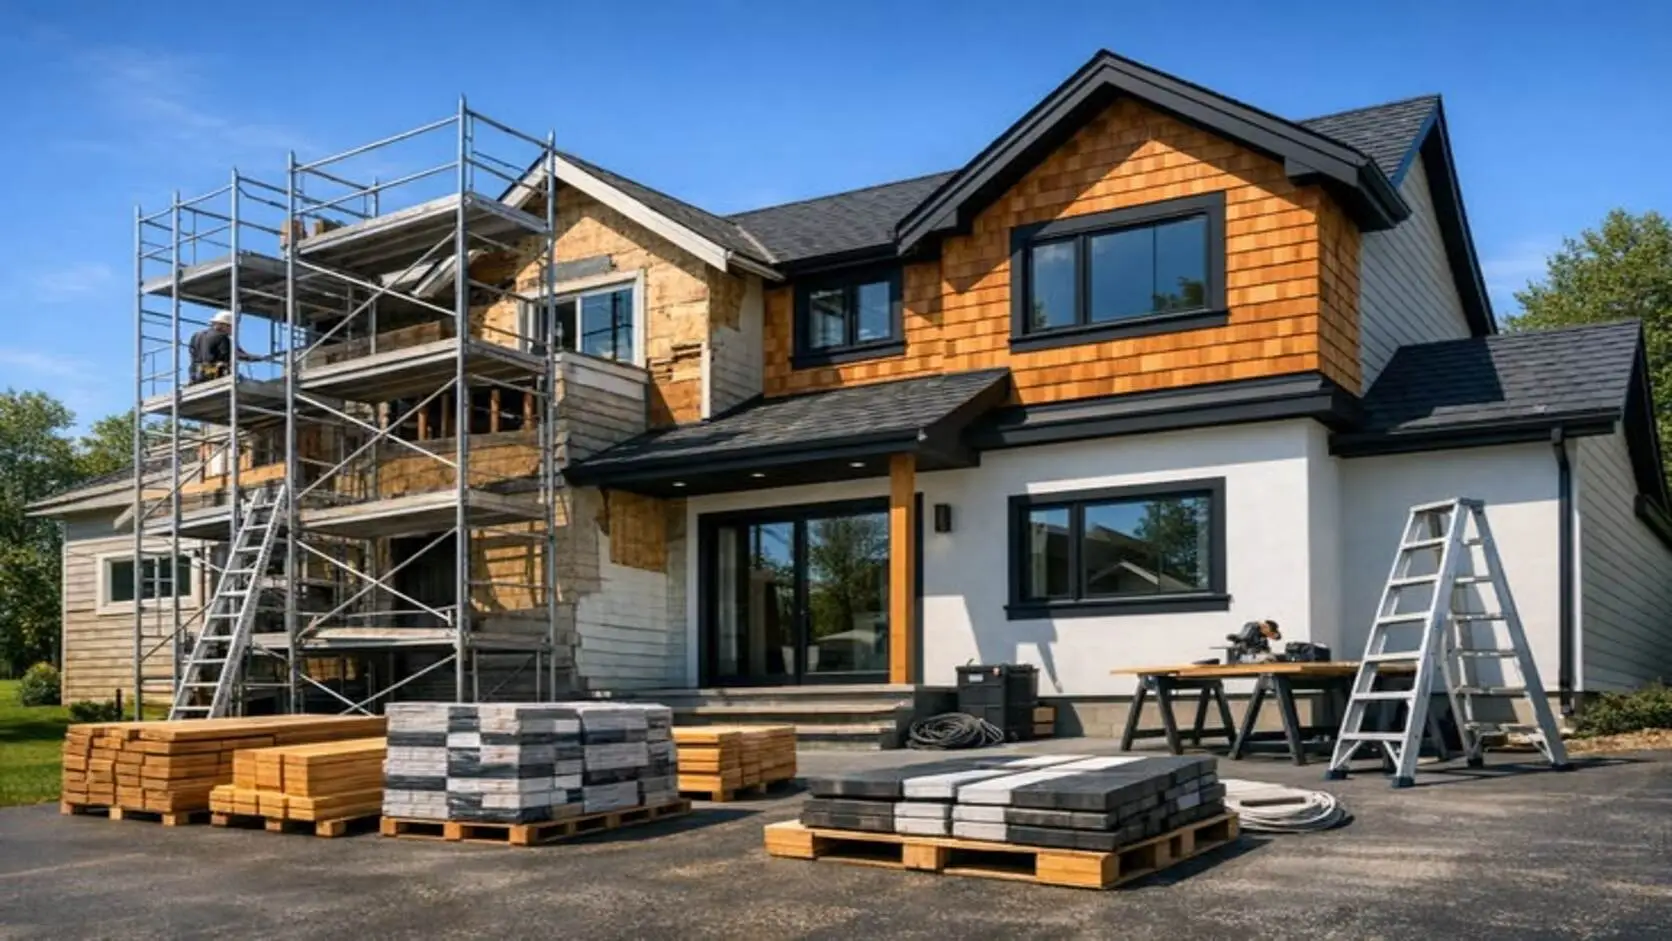
Texas homebuilding picked up speed in August 2026. Builders in the state’s four largest metros pulled 6,497 new residential permits with a combined estimated construction value of about $2.31 billion, according to HBWeekly’s residential construction data. That’s a 19% increase on July.
The headline number is strong, but the detail underneath is more revealing. Houston led on volume, Dallas nearly matched it on value, and a suburban county north of Houston quietly out-built the state’s most populous county. Here’s the breakdown.
Metro by metro
| Metro | Permits | Share of permits | Construction value | Share of value | Avg. value per permit |
|---|---|---|---|---|---|
| Houston | 2,932 | 45.1% | $936.4M | 40.5% | $319,376 |
| Dallas | 2,227 | 34.3% | $921.7M | 39.9% | $413,880 |
| Austin | 840 | 12.9% | $296.7M | 12.8% | $353,249 |
| San Antonio | 498 | 7.7% | $156.3M | 6.8% | $313,764 |
| Total | 6,497 | 100% | $2.31B | 100% | ≈ $355,700 |
Shares and the overall average are calculated from HBWeekly’s published figures.
Houston: volume leader
Houston accounted for nearly half of all permits, and HBWeekly called it “the undisputed epicenter of Texas homebuilding activity.” But its average permit value of about $319,000 was one of the lowest of the four metros, pointing to a market driven by volume and suburban entry-level and move-up homes.
Dallas: fewer homes, bigger tickets
Dallas pulled about 700 fewer permits than Houston, yet its total construction value was almost identical, about $922 million against Houston’s $936 million. Its average permit value of nearly $414,000 was the highest in the state, reflecting larger homes, higher-end finishes and higher land values.
Austin: design-led demand
Austin’s 840 permits were concentrated in just two counties, with an average value of about $353,000. HBWeekly points to buyer demand for higher-spec, architecturally distinctive homes.
San Antonio: steady and affordable
San Antonio had the smallest share, with 498 permits and the lowest average value of the four metros at about $314,000.
County by county
| County | Metro | Permits | Construction value | Avg. value per permit |
|---|---|---|---|---|
| Montgomery | Houston | 957 | $249.1M | $260,278 |
| Harris | Houston | 900 | $346.7M | $385,213 |
| Tarrant | Dallas | 726 | $310.1M | $427,131 |
| Collin | Dallas | 624 | $226.8M | $363,473 |
| Travis | Austin | 406 | $125.5M | $309,006 |
| Williamson | Austin | 353 | $123.8M | $350,673 |
| Bexar | San Antonio | 285 | $93.5M | $328,153 |
Average values per permit are calculated from HBWeekly’s permit counts and construction values.
Three things stand out:
- Montgomery County out-built Harris County. Montgomery, home to The Woodlands, Conroe and Magnolia, recorded 957 permits, more than Harris County’s 900 and the most of any county in the report.
- Montgomery is building at a lower price point. Its average permit value of about $260,000 was the lowest of the seven counties, well below Harris at about $385,000. That suggests much of the growth is in more affordable suburban homes.
- Tarrant is the high-value leader. Tarrant County combined strong volume (726 permits) with the highest average value, about $427,000.
What the numbers mean
For buyers
More new homes, especially in Montgomery County and the outer suburbs, mean more choice and potentially more builder incentives. Buyers willing to look north of Houston may find newer homes at lower price points than closer-in areas.
For sellers of existing homes
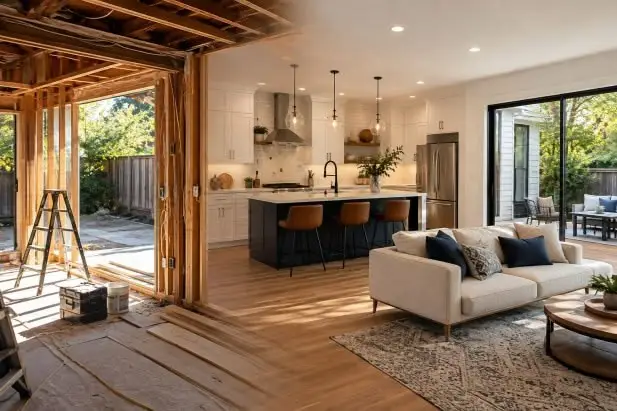
New construction sets buyer expectations. When hundreds of new homes come to market nearby every month, older homes are compared with modern kitchens, open layouts and new bathrooms. Sellers in fast-growing areas may need updates, or sharper pricing, to compete.
For investors
Rapid suburban growth usually brings new residents, jobs and services, which supports rental demand. But it also adds supply. In markets with heavy new construction, renovated older homes in established neighbourhoods can stand out by offering location and mature lots alongside modern interiors.
A note of caution
One month doesn’t make a trend. HBWeekly itself described August as “a momentary snapshot rather than a sweeping trend.” The figures are permits, not completed homes or sales, and permit values are construction-cost estimates rather than market prices. The report also covers only four metros and doesn’t include year-over-year comparisons. These numbers are best read as a signal of where builders are focusing, not a forecast.
Competing with new construction: the remodel option
For owners of existing homes in Montgomery County’s growth corridor, the most practical response to new-build competition is often renovation rather than relocation. Updated kitchens and bathrooms, home additions and refreshed exteriors help older homes match what buyers see in new communities, while keeping the location advantages new developments can’t offer.
Select Remodeling & Construction, a design-build remodeling firm based in The Woodlands, works with homeowners and investors across The Woodlands, Spring, Tomball, Conroe and Magnolia on kitchen remodeling, bathroom remodeling, home additions and whole-home renovations designed to raise both livability and market value.
👉 Learn more at selectremodelingandconstruction.com
The bottom line
August 2026 confirmed that Texas is still building at scale, with Houston leading on volume, Dallas leading on value and Montgomery County emerging as the state’s busiest county for new homes. For buyers it means choice, for sellers it means competition, and for everyone watching the Texas market, it’s a clear sign of where growth is heading next.
Source: Texas New Home Construction Surges in August 2026, HBWeekly, September 10, 2026. Shares and per-county averages are calculated from HBWeekly’s published figures.